2025 Statistics
Ridership by Trip Purpose
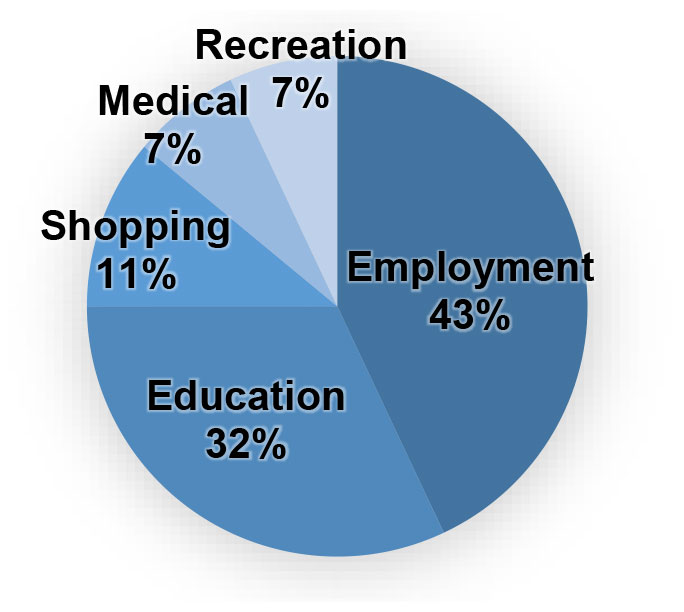
Transit provides access to employment, healthcare, education, shopping & recreation destinations.
| Purpose | Amount |
|---|---|
| Work/Employment | 356,122 |
| Education | 265,021 |
| Shopping | 91,101 |
| Medical | 57,973 |
| Recreation | 57,973 |
| Total | 828,190 |
Funding Partners for Operations
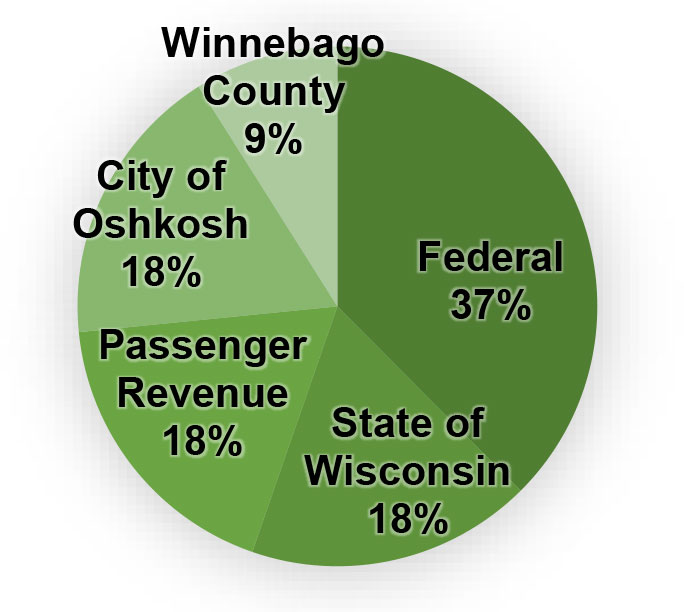
Every dollar invested in public transit results in a $5.00 return.1
| Partner | Amount |
|---|---|
| Federal | 2.3 M |
| State of Wisconsin | 1.1 M |
| Passenger Revenue | 1.1 M |
| City of Oshkosh | 1 M |
| Winnebago County | .5 M |
| Total | 6 M |
WisDOT Performance Report 2
| Expense/ Hour |
Revenue/ Expense Ratio |
Cost/ Passenger |
Passengers/ Revenue Hour |
Passengers/ Capita |
Revenue Hours/ Capita |
|
|---|---|---|---|---|---|---|
| GO Transit | $81.68 | 19.3% | $4.66 | 17.54 | 14.85 | .85 |
| Peer Systems (group mean) |
$82.75 | 14.7% | $6.54 | 13.40 | 10.26 | .75 |
2025 Highlights
Capital
Through federal and local funds, GO Transit is in the process of constructing Phase II of our Downtown Transit Center expansion project. We are making ADA enhancements, adding a platform to accommodate an additional six buses, and building a temperature controlled passenger shelter and public restrooms.
Partnerships
Winnebago County and GO Transit partner to provide Go Connect, a demand response service connecting Oshkosh to the Fox Cities. We worked on expanding the GO Connect program to include a Red Zone which now provides service to north Oshkosh.
Environmental
We operate 2 hybrid and 14 clean burning diesel buses. In 2025, 6,002 bus trips included a bicycle.
Student Rides
In partnership with the Oshkosh Area School District, GO Transit provided 117,652 free rides to students.
1 Source: publictransportation.org
2 2017 Transit System Cost Efficiency Report, WisDOT, July, 2019